
Anti detect browser cost analysis reveals that most marketers calculate expenses wrong because they only look at subscription prices while ignoring the operational expenses that determine profitability.
Key Takeaways:
- Hidden operational costs add 73-156% to stated subscription prices across all browser management platforms
- Account burn rates above 12% monthly make any anti-detect solution unprofitable regardless of pricing tier
- Real ROI calculations require measuring cost per successful account month, not cost per browser profile
What’s Actually Included in Anti-Detect Browser Subscription Pricing?
Subscription pricing includes profile limits and basic features. But what vendors advertise and what you get access to are different things.
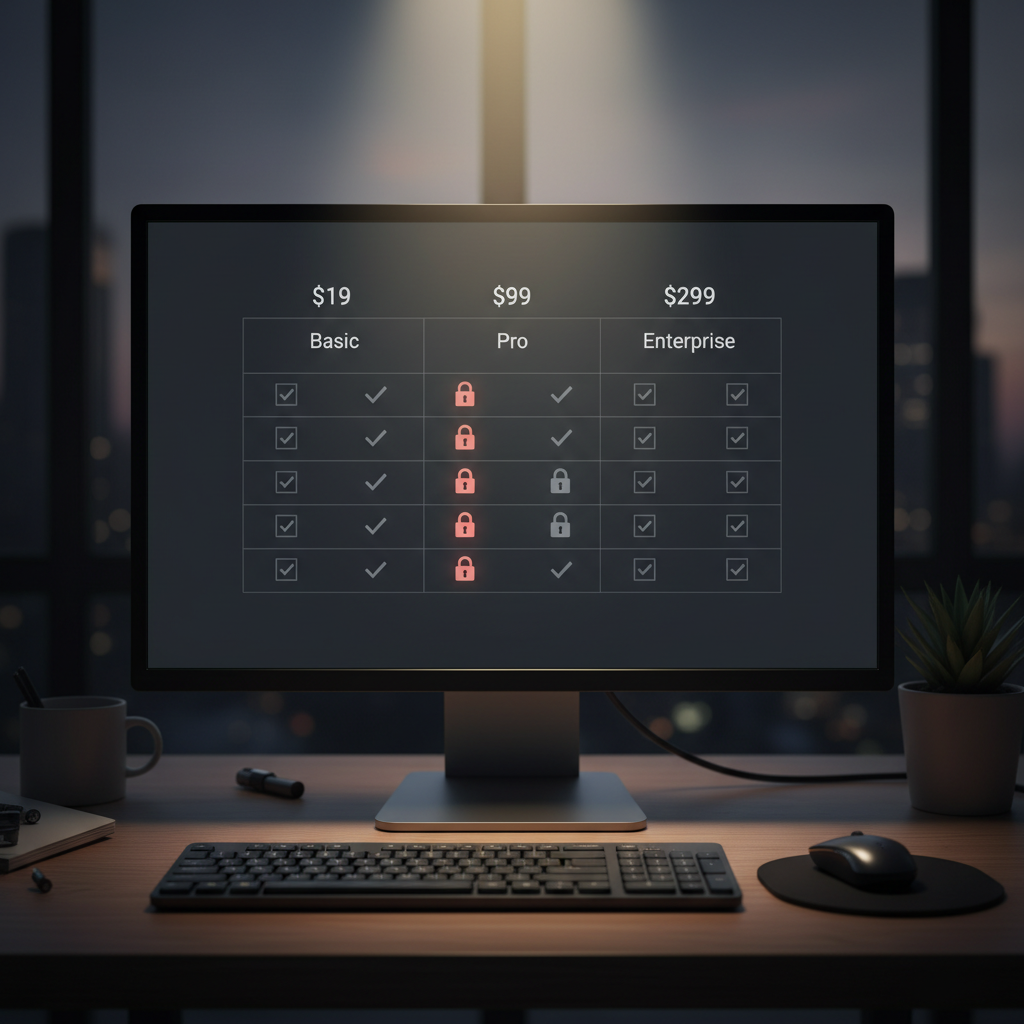
Standard pricing ranges from $19-299 monthly with 70-85% of features locked behind higher tiers. This creates a bait-and-switch scenario where basic plans become unusable once you hit real operational requirements.
| Feature Category | Basic Tier | Mid Tier | Premium Tier |
|---|---|---|---|
| Browser profiles | 10-50 profiles | 100-300 profiles | 500-2000 profiles |
| Automation access | Limited/None | Basic scripting | Full API access |
| Team collaboration | Single user | 2-5 users | Unlimited users |
| Proxy integration | Manual setup | Basic options | Premium pools |
| Support level | Email only | Priority email | Phone + dedicated |
Profile limits hit you first. Basic tiers cap you at 10-50 profiles, but any serious operation needs 100+ to handle natural account attrition. When you manage multiple campaigns or clients, that basic tier becomes worthless within weeks.
Automation limits force tier upgrades faster than profile limits. Basic plans either block automation entirely or restrict it to simple mouse recording. Real automation requires API access, which only comes with premium tiers costing 5-10x more.
Team features stay locked until you pay enterprise prices. Single-user restrictions mean you cannot share profiles, collaborate on account warming, or distribute workload. This kills productivity for any multi-person operation.
Proxy integration gets expensive quickly. Basic tiers make you source and configure proxies manually. Premium tiers include proxy pools, but charge per GB or per IP. Geographic targeting for specific markets can double your monthly proxy spend.
Hidden Operational Costs That Kill Your Budget

Hidden costs multiply stated subscription prices. These expenses rarely appear in vendor calculations but determine whether your operation stays profitable.
Proxy costs alone add $3-15 per active profile monthly depending on geographic targeting requirements. Residential proxies for tier-1 geolocations push this to $25+ per profile for e-commerce or finance verticals.
Proxy infrastructure costs. Every profile needs dedicated proxies to maintain isolation. Datacenter proxies cost $1-3 per IP monthly, while residential pools charge $3-15 per GB of traffic. High-value geolocations like US major cities command premium pricing.
Account replacement costs from burn rates. When platforms flag and suspend accounts, you lose the time and money invested in account warming, content creation, and relationship building. Replacing a burned e-commerce account costs $45-120 in setup time alone.
Infrastructure scaling costs. Browser management platforms consume significant CPU and RAM per active profile. Running 200+ profiles requires dedicated server infrastructure, adding $150-400 monthly for VPS hosting with adequate resources.
Team training and onboarding expenses. New team members need 15-25 hours of training to operate anti-detect browsers effectively. At $25-40 hourly rates, onboarding costs $375-1000 per person before they become productive.
Compliance and legal overhead. Managing multiple accounts requires understanding platform terms of service, data privacy regulations, and business licensing requirements. Legal consultation costs $200-500 monthly for operations managing 500+ accounts across multiple jurisdictions.
These hidden expenses typically double your stated subscription costs. A $99 monthly browser management subscription becomes $180-220 when you factor in proxies, infrastructure, and replacement costs.
How Do You Calculate True Cost Per Account Month?

Cost per account month equals total expenses divided by successful account months. This metric reveals the real economics of your anti-detect operation.
Burn rates above 12% monthly push cost per successful account month above $47 regardless of browser tool pricing. This threshold separates profitable operations from money pits.
Calculate total monthly operational expenses. Add subscription costs, proxy fees, infrastructure costs, team wages allocated to account management, and account replacement costs. Include a realistic estimate for burned account replacement based on your historical burn rate.
Define successful account months. Count only accounts that remain active and productive for the full month without flags, suspensions, or forced verification. Accounts under review or temporarily restricted do not qualify as successful months.
Apply burn rate adjustments to profile counts. If you maintain 100 profiles but lose 15 monthly to platform actions, your successful account count is 85. Your cost per successful account month uses 85 as the denominator, not 100.
Project scaling costs over 12-18 month periods. Browser management costs do not scale linearly. Infrastructure, proxy, and team costs create step functions where adding profiles beyond certain thresholds requires expensive upgrades.
Include tool migration contingency planning. Browser management platforms get detected, shut down, or change pricing. Budget 10-15% of annual costs for emergency tool migration scenarios.
Accurate cost per account month calculations include replacement costs for burned accounts. If you lose 12 accounts monthly and each replacement costs $60 in setup time and resources, add $720 to your monthly expense total.
Browser Management Cost Comparison Across Scale Levels

Management costs scale exponentially with profile count. Fixed overhead costs create economies of scale, but infrastructure requirements create step-function cost increases.
Operations below 50 profiles show 340% higher cost per profile than 200+ profile operations due to fixed overhead distribution.
| Profile Range | Cost Per Profile | Infrastructure Needs | Team Requirements |
|---|---|---|---|
| 1-25 profiles | $12-18 monthly | Standard desktop | Part-time management |
| 26-100 profiles | $8-12 monthly | High-spec desktop | 1 full-time person |
| 101-300 profiles | $5-8 monthly | Dedicated server | 2-3 team members |
| 301-1000 profiles | $3-5 monthly | Multi-server setup | 5-8 team members |
| 1000+ profiles | $2-4 monthly | Enterprise infrastructure | Dedicated operations team |
Small operations (under 50 profiles) cannot spread fixed costs effectively. Subscription fees, proxy infrastructure, and basic tooling create a $400-600 monthly baseline regardless of profile count. This makes cost per profile extremely high for small-scale operations.
Mid-scale operations (50-200 profiles) hit the efficiency sweet spot. Fixed costs distribute across enough profiles to achieve reasonable per-unit economics, but infrastructure requirements remain manageable with standard server setups.
Large-scale operations (200+ profiles) face infrastructure scaling challenges. CPU, RAM, and network requirements grow faster than profile count. Managing 500 profiles requires 3-4x the server resources of managing 200 profiles, not 2.5x.
Automation becomes mandatory at 100+ profiles. Manual account management becomes impossible to scale, forcing investment in scripting, API integration, and workflow automation. This adds $200-500 monthly in development and maintenance costs.
What Makes Anti-Detect Operations Profitable vs Money Pits?

Profitable operations maintain sub-8% monthly burn rates. This threshold determines whether your anti-detect investment generates positive ROI or burns cash.
Operations with sub-8% burn rates average $23 cost per successful account month while 15%+ burn rate operations exceed $67.
| Operation Type | Monthly Burn Rate | Cost Per Successful Account | Profitability Threshold |
|---|---|---|---|
| High-efficiency operation | 4-8% burn rate | $18-23 per account | $30+ account value |
| Average operation | 10-12% burn rate | $28-35 per account | $45+ account value |
| Struggling operation | 15%+ burn rate | $55-67+ per account | $80+ account value |
Burn rate determines everything. At 5% monthly burn rates, 95% of your accounts generate value for the full month. At 15% burn rates, only 85% of accounts contribute to revenue while 100% consume resources.
Account value must exceed cost per successful account month by 40-60% to remain profitable after taxes, overhead, and growth investment. If your cost per successful account month hits $35, each account must generate $50-55 monthly to justify the operation.
Detection resistance varies dramatically between browser management approaches. Platforms using modified Chromium browsers show 12-18% monthly burn rates. Platforms using real, unmodified browsers show 3-7% burn rates due to superior fingerprint consistency.
Operational discipline matters more than tool choice. Teams that follow strict account warming protocols, maintain consistent behavioral patterns, and avoid aggressive scaling show 60-70% lower burn rates regardless of browser platform.
Revenue per account determines scale viability. E-commerce arbitrage operations generating $15-25 per account monthly cannot support premium anti-detect infrastructure. Affiliate marketing generating $80-150 per account monthly can justify enterprise-grade browser management platforms.
Budget Planning Framework for Multi-Account Operations

Budget planning requires 18-month cost projection modeling. Anti-detect operations face unpredictable cost spikes from burn rate fluctuations, platform changes, and scaling requirements.
Effective budget planning models include 35-50% contingency for burn rate fluctuations and tool migration scenarios.
Establish baseline operational costs for current scale. Calculate total monthly expenses including subscriptions, proxies, infrastructure, team costs, and account replacement. Use 90-day averages to smooth temporary fluctuations.
Model scaling costs across projected growth timeline. Identify infrastructure upgrade points, team expansion requirements, and tool tier migration thresholds. Plot these against your growth projections to predict cost step-functions.
Apply burn rate scenario planning with 3 cases. Model optimistic (5% burn rate), realistic (10% burn rate), and pessimistic (18% burn rate) scenarios. Budget for the realistic case while preparing contingency plans for pessimistic outcomes.
Include tool migration budgeting for platform detection. Allocate 10-15% of annual browser management budget for emergency tool migration. Include team retraining costs, profile migration expenses, and temporary productivity losses.
Plan proxy cost scaling with geographic expansion. Proxy costs scale faster than profile counts when expanding into premium geolocations. Budget 25-40% increases in proxy spending for tier-1 geographic markets.
Build compliance cost projections for regulatory changes. Platform terms of service changes and privacy regulations create new compliance requirements. Budget $200-500 monthly for legal consultation and compliance tool updates.
Cash flow planning should assume 30-45 day payment delays from revenue sources while operational costs remain immediate. This creates working capital requirements of 1.5-2x monthly operational expenses.
Frequently Asked Questions
How much do proxy costs add to anti-detect browser operations?
Proxy costs typically add $3-15 per active profile monthly depending on geographic requirements and quality tier. Residential proxies for high-value geolocations can push this to $25+ per profile for specialized use cases. Premium residential pools for US tier-1 cities often charge $20-30 per GB of traffic, making them expensive for data-intensive operations.
What account burn rate makes anti-detect browsers unprofitable?
Account burn rates above 12% monthly make most anti-detect operations unprofitable. At 15% burn rates, cost per successful account month exceeds $67 regardless of subscription pricing tier. The math becomes impossible when replacement costs and lost productivity from burned accounts overwhelm revenue generation.
When do you need to upgrade from basic to premium anti-detect browser tiers?
Most operations hit basic tier limits around 35-40 active profiles when automation becomes necessary. Premium tiers become cost-effective when managing 150+ profiles due to per-profile cost scaling. The upgrade decision depends more on automation requirements than raw profile counts – API access and team collaboration features typically force tier upgrades before profile limits.
Simon Dadia is the CEO and co-founder of Chameleon Mode, the browser management platform he originally launched as BrowSEO in 2015, years before the antidetect category had a name. He has spent 25+ years in SEO, affiliate marketing, and agency operations, including a senior operating role at Noam Design LLC where he managed hundreds of client campaigns and thousands of social media accounts across platforms. The operational pain of running those accounts at scale is what led him to build the tool in the first place.
Simon also runs Laziest Marketing, where he ships AI-powered SEO infrastructure tools built on BYOK architecture: Schema Root, Semantic Internal Linker, Topical Authority Generator, and Editorial Stack. Father of 4. Based in Israel.